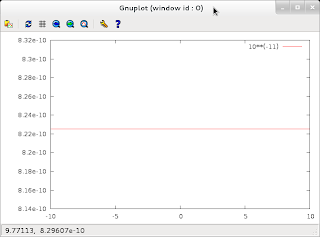
Gnuplot 4.4.0-1.1 (the current Debian version) can't handle numbers smaller than 10**(-9) properly
e.g.
me@beryllium:~/Dropbox$ gnuplot
G N U P L O T
Version 4.4 patchlevel 0
last modified March 2010
System: Linux 3.2.0-1-amd64
Copyright (C) 1986-1993, 1998, 2004, 2007-2010
Thomas Williams, Colin Kelley and many others
gnuplot home: http://www.gnuplot.info
faq, bugs, etc: type "help seeking-assistance"
immediate help: type "help"
plot window: hit 'h'
Terminal type set to 'wxt'
gnuplot> print 10**(-9)
1e-09
gnuplot> print 10**(-10)
7.09186959928599e-10
gnuplot> print 10**(-11)
8.22536045240377e-10
It's not related to set zero.
gnuplot> set zero 1e-20
gnuplot> print 10**(-11)
8.22536045240377e-10
gnuplot> print 10**(-10)
7.09186959928599e-10
gnuplot> print 10**(-9)
1e-09
gnuplot>
Currently, I'm using version 4.4.0-1.1 -- which is used in all versions of Debian.
me@beryllium:~$ apt-cache showpkg gnuplot
Package: gnuplot
Versions:
4.4.0-1.1 (/var/lib/apt/lists/ftp.au.debian.org_debian_dists_testing_main_binary-amd64_Packages) (/var/lib/apt/lists/ftp.au.debian.org_debian_dists_stable_main_binary-amd64_Packages) (/var/lib/apt/lists/ftp.au.debian.org_debian_dists_unstable_main_binary-amd64_Packages) (/var/lib/dpkg/status)
..
Dependencies:
4.4.0-1.1 - gnuplot-nox (2 4.4.0-1.1) gnuplot-x11 (2 4.4.0-1.1) gnuplot-doc (2 4.4.0-1.1)
Provides:
4.4.0-1.1 -
Reverse Provides:
The bug affects the output from the print statement as well as the internal handling of numbers:
gnuplot> plot 10**(-11)
Warning: empty y range [8.22536e-10:8.22536e-10], adjusting to [8.14311e-10:8.30761e-10]
gnuplot> plot 10**(-12)
Warning: empty y range [-1.3748e-09:-1.3748e-09], adjusting to [-1.36105e-09:-1.38855e-09]
gnuplot> plot 10**(-12)/10**(-10)
Warning: empty y range [-1.93855:-1.93855], adjusting to [-1.91917:-1.95794]
gnuplot> set xrange [10**(-9):10**(-12)]
gnuplot> plot x
The bug is similar to this: http://bugs.debian.org/cgi-bin/bugreport.cgi?bug=360087
Integer overflows are not reported. A hint could be printed that realwhich ended up with "Added tag(s) wontfix. "
(float) numbers should (could) be used to avaid this problem.
gnuplot> print 1000000*100000
1215752192
gnuplot> print 1000000**2
-727379968
gnuplot> print 100000**2
1410065408
gnuplot> a=2000000**2
gnuplot> print a
1385447424
gnuplot> print 10000**2 # OK
100000000
Ergo, if you're using debian and you are using gnuplot for serious purposes (research, work), compile your own version of gnuplot as per below.
ANNOYING: there are packages such as maxima which depend on gnuplot. Remove the debian version of gnuplot using apt-get and you lose maxima too. Octave, which one would think would be a heavier user of gnuplot, does not depend on gnuplot but merely recommends it.
Package: maxima
State: not installed
Version: 5.26.0-3
Priority: optional
Section: math
Maintainer: Camm Maguire <camm@debian.org>
Uncompressed Size: 47.8 M
Depends: libc6 (>= 2.3), libgmp10, libreadline6 (>= 6.0), libx11-6, gnuplot-x11
Maybe time to build your own maxima.deb? In the end you will end up with a very inelegant system with mixed packages.
Upstreams:
I've compiled and checked the current upstreams version:
me@beryllium:~$ sudo apt-get autoremove gnuplot gnuplot-nox
cd ~/temp
wget http://downloads.sourceforge.net/project/gnuplot/gnuplot/4.4.4/gnuplot-4.4.4.tar.gz?r=http%3A%2F%2Fsourceforge.net%2Fprojects%2Fgnuplot%2Ffiles%2F&ts=1329439455&use_mirror=aarnet
mv gnuplot-4.4.4.tar.gz\?r\=http\:%2F%2Fsourceforge.net%2Fprojects%2Fgnuplot%2Ffiles%2F gnuplot-4.4.4.tar.gz
tar -xvf gnuplot-4.4.4.tar.gz
./configure
make
sudo checkinstall
Ergo, upstreams v 4.4.4 works.
./configure
make
sudo checkinstall
me@beryllium:~/temp/gnuplot-4.4.4$ sudo dpkg -i gnuplot_4.4.4-1_amd64.deb
(Reading database ... 446323 files and directories currently installed.)
Preparing to replace gnuplot 4.4.4-1 (using gnuplot_4.4.4-1_amd64.deb) ...
Unpacking replacement gnuplot ...
Setting up gnuplot (4.4.4-1) ...
Processing triggers for man-db ...
me@beryllium:~/temp/gnuplot-4.4.4$ gnuplot
G N U P L O T
Version 4.4 patchlevel 4
last modified November 2011
System: Linux 3.2.0-1-amd64
Copyright (C) 1986-1993, 1998, 2004, 2007-2011
Thomas Williams, Colin Kelley and many others
gnuplot home: http://www.gnuplot.info
faq, bugs, etc: type "help seeking-assistance"
immediate help: type "help"
plot window: hit 'h'
Terminal type set to 'x11'
gnuplot> print 10**(-9)
1e-09
gnuplot> print 10**(-10)
1e-10
gnuplot> print 10**(-11)
1e-11
gnuplot> print 3.14*10**(-10)
3.14e-10
gnuplot> print 3.14*10**(-20)
3.14e-20
gnuplot> print 3.14*10**(-21)
3.14e-21
gnuplot> print 3*10**(-12)/(4*10**(-14))
75.0
gnuplot>
Update: Here's my bug report:
http://bugs.debian.org/cgi-bin/bugreport.cgi?bug=660299


