Showing posts with label mass spectrometry. Show all posts

31 July 2013

486. MS data, part IV: Making a stacked spectrum plot using gnuplot

In part 1, I showed you how to export MS data (MS= Mass Spectrometer/ry): http://verahill.blogspot.com.au/2013/07/474-exporting-data-from-wsearch32-and.html

In part 2, I showed you how to generate theoretical isotopic envelopes, and how to compare them with observed ones: http://verahill.blogspot.com.au/2013/07/480-ms-data-part-ii-plotting-and.html

In part 3, I showed you how to make contour plots of '3D' data -- in that particular case the extra dimension was cone voltage, but it could just as easily have been time: http://verahill.blogspot.com.au/2013/07/ms-data-part-iii-generating-matrix-by.html

In part 4, we'll use the same data as in part 3, but we'll make a stacked plot of it. This is a short post.

There is at least one other way of making a stacked plot in gnuplot, but it doesn't yield what I'd consider as being publication quality plots. It's also fairly restrictive in the type of data can be plotted. The method shown here is general and applicable to all types of data. You can e.g. use it for time-dependent NMR data...

Here's an example of a gnuplot script:
### Preamble start
set term png size 1000,500
set output 'stack.png'

set border 1
set xtics nomirror
set ytics nomirror
unset ytics

set xrange [100:3000]
set yrange [0:100]

set multiplot
set size 0.85,0.45
unset key

### Preamble over

### The stacked plot
set origin 0,0
set label "m/z" at 1500, -18
plot '0.dat' with lines lt -1

# we want the x axis to show ONLY for the first spectrum,
# so we turn it off for the remaining spectra.
# The same goes for our label (xlabel can be tricky 
# to position correctly)
unset label
set border 0
unset xtics
unset ytics

# Here we set the spacing (fx) the initial position of the second spectrum (f),
# the initial horizontal offset of the second spectrum relative to the first one (g),
# and the horizontal offset for all subsequent spectra (gy)

f=0.0025
fx=0.00
g=0.01
gy=0.02

# then we plot all the other spectra
set origin fx+0*f,gy+0*g
plot '10.dat' with lines lt -1

set origin fx+1*f,gy+1*g
plot '20.dat' with lines lt -1

set origin fx+2*f,gy+2*g
plot '30.dat' with lines lt -1

set origin fx+3*f,gy+3*g
plot '40.dat' with lines lt -1

set origin fx+4*f,gy+4*g
plot '50.dat' with lines lt -1

set origin fx+5*f,gy+5*g
plot '60.dat' with lines lt -1

set origin fx+6*f,gy+6*g
plot '70.dat' with lines lt -1

set origin fx+7*f,gy+7*g
plot '80.dat' with lines lt -1

set origin fx+8*f,gy+8*g
plot '90.dat' with lines lt -1

set origin fx+9*f,gy+9*g
plot '100.dat' with lines lt -1

set origin fx+10*f,gy+10*g
plot '110.dat' with lines lt -1

set origin fx+11*f,gy+11*g
plot '120.dat' with lines lt -1

set origin fx+12*f,gy+12*g
plot '130.dat' with lines lt -1

set origin fx+13*f,gy+13*g
plot '140.dat' with lines lt -1

set origin fx+14*f,gy+14*g
plot '150.dat' with lines lt -1

set origin fx+15*f,gy+15*g
plot '160.dat' with lines lt -1

set origin fx+16*f,gy+16*g
plot '170.dat' with lines lt -1

set origin fx+17*f,gy+17*g
plot '180.dat' with lines lt -1

set origin fx+18*f,gy+18*g
plot '190.dat' with lines lt -1

set origin fx+19*f,gy+19*g
plot '200.dat' with lines lt -1

set origin fx+20*f,gy+20*g
plot '210.dat' with lines lt -1

set origin fx+21*f,gy+21*g
plot '220.dat' with lines lt -1

set origin fx+22*f,gy+22*g
plot '230.dat' with lines lt -1

set origin fx+23*f,gy+23*g
plot '240.dat' with lines lt -1

set origin fx+24*f,gy+24*g
plot '250.dat' with lines lt -1

set origin fx+25*f,gy+25*g
plot '260.dat' with lines lt -1

set origin fx+26*f,gy+26*g
plot '270.dat' with lines lt -1

set origin fx+27*f,gy+27*g
plot '280.dat' with lines lt -1

set origin fx+28*f,gy+28*g
plot '290.dat' with lines lt -1

set origin fx+29*f,gy+29*g

plot '300.dat' with lines lt -1


and here's the plot:

If you want to make it really fancy, try this:
### Preamble start
set term png size 1000,800
set output 'stack.png'

set border 1
set xtics nomirror
set ytics nomirror
unset ytics

set xrange [100:3000]
set yrange [0:100]

set multiplot
set size 0.85,0.25
unset key

### Preamble over

### The stacked plot
set origin 0,0
set label "m/z" at 1500, -18
plot '0.dat' with lines lt -1

# we want the x axis to show ONLY for the first spectrum,
# so we turn it off for the remaining spectra.
# The same goes for our label (xlabel can be tricky 
# to position correctly)
unset label
set border 0
unset xtics
unset ytics

# Here we set the spacing (fx) the initial position of the second spectrum (f),
# the initial horizontal offset of the second spectrum relative to the first one (g),
# and the horizontal offset for all subsequent spectra (gy)

f=0.0025
fx=0.00
g=0.01
gy=0.02

# then we plot all the other spectra
set origin fx+0*f,gy+0*g
plot '10.dat' with lines lt -1

set origin fx+1*f,gy+1*g
plot '20.dat' with lines lt -1

set origin fx+2*f,gy+2*g
plot '30.dat' with lines lt -1

set origin fx+3*f,gy+3*g
plot '40.dat' with lines lt -1

set origin fx+4*f,gy+4*g
plot '50.dat' with lines lt -1

set origin fx+5*f,gy+5*g
plot '60.dat' with lines lt -1

set origin fx+6*f,gy+6*g
plot '70.dat' with lines lt -1

set origin fx+7*f,gy+7*g
plot '80.dat' with lines lt -1

set origin fx+8*f,gy+8*g
plot '90.dat' with lines lt -1

set origin fx+9*f,gy+9*g
plot '100.dat' with lines lt -1

set origin fx+10*f,gy+10*g
plot '110.dat' with lines lt -1

set origin fx+11*f,gy+11*g
plot '120.dat' with lines lt -1

set origin fx+12*f,gy+12*g
plot '130.dat' with lines lt -1

set origin fx+13*f,gy+13*g
plot '140.dat' with lines lt -1

set origin fx+14*f,gy+14*g
plot '150.dat' with lines lt -1

set origin fx+15*f,gy+15*g
plot '160.dat' with lines lt -1

set origin fx+16*f,gy+16*g
plot '170.dat' with lines lt -1

set origin fx+17*f,gy+17*g
plot '180.dat' with lines lt -1

set origin fx+18*f,gy+18*g
plot '190.dat' with lines lt -1

set origin fx+19*f,gy+19*g
plot '200.dat' with lines lt -1

set origin fx+20*f,gy+20*g
plot '210.dat' with lines lt -1

set origin fx+21*f,gy+21*g
plot '220.dat' with lines lt -1

set origin fx+22*f,gy+22*g
plot '230.dat' with lines lt -1

set origin fx+23*f,gy+23*g
plot '240.dat' with lines lt -1

set origin fx+24*f,gy+24*g
plot '250.dat' with lines lt -1

set origin fx+25*f,gy+25*g
plot '260.dat' with lines lt -1

set origin fx+26*f,gy+26*g
plot '270.dat' with lines lt -1

set origin fx+27*f,gy+27*g
plot '280.dat' with lines lt -1

set origin fx+28*f,gy+28*g
plot '290.dat' with lines lt -1

set origin fx+29*f,gy+29*g

plot '300.dat' with lines lt -1

### second plot
set size 0.75,0.4
set origin 0.1,0.6
set xrange [800:1800]
set border 3
set xtics nomirror
set ytics nomirror
set xlabel 'm/z'
set ylabel 'Relative abundance (%)'
set title '20 V'

plot '20.dat' with lines lt -1

unset multiplot

which looks like this:

23 July 2013

483. MS data, part III: generating a matrix by combining several spectra, and plotting it in gnuplot

This post is primarily intended for two particular students. However, the problem it addresses is something that a lot of spectrometrists/scopists who want to take their data presentation to the next level have encountered.

My presumption:
You're running linux.

You've already exported your data as csv files as shown in this post: http://verahill.blogspot.com.au/2013/07/474-exporting-data-from-wsearch32-and.html

In addition, for the specifics in the commands below I will presume that this data is based on a cone voltage sweep from 0 to 300 in 10 volt steps. I thus have a series of files named: 0.csv, 10.csv, 20.csv..190,300.csv.

You should be able to easily customize the approach to e.g. time or concentration dependent data.

Let's get started:
0. Pre-reqs
Make sure you have gawk, sed, xargs, gnuplot, paste, python installed. On debian do
sudo apt-get install gawk sed xargs gnuplot paste python

1. Convert the csv files to dat files
Create the following script and call it csv2dat.sh
#!/bin/bash for e in 0 10 20 30 40 50 60 70 80 90 100 110 120 130 140 150 160 170 180 190 200 210 220 230 240 250 260 270 280 290 300 do tail -n +8 $e.csv | sed 's/\,/\t/g'| gawk '{print $2,$4}' > $e.dat done
and run it
sh csv2dat.sh

If all went well, you'll have a series of tab-separated .dat files which contain the m/z and the relative abundance (not absolute).

2. Extract ALL m/z values from all files
Create a file called homogenize.sh and put the following in it:
#!/bin/bash for e in {0..200..10} {210..300..10} do cat $e.dat | gawk '{print $1}' echo "" done
We'll run the homogenize script (it does nothing of the sort though), and then use the unix tools unique and sort to get rid of all non-unique m/z values, and to sort them in reverse numerical order:
sh homogenize.sh > allmz.dat
uniq allmz.dat temp.dat
sort -gr temp.dat > mz.dat

3. Pad the data with zeroes
Create a file called makelist.py, and put the following in it. Watch out for tab lengths etc. It's written for python 2.x, and probably won't work under python 3. It was also hacked together from an earlier script which didn't quite work the way I hoped it would.

#!/usr/bin/env python
import sys
from numpy import linspace
infile=sys.argv[1]

f=open(infile,'r')
arr=[]

print "Read %s" %infile
for line in f:
 line=line.rstrip('\n')
 try:
  arr+=[round(float(line),3)]
 except:
  pass
  #print line
f.close

mylist=arr
mylist.sort(reverse=True)

print "Calculating spacing"
spacing=1.0
old=max(mylist)
for i in range(0,len(mylist)):
 if round(abs(old-mylist[i]),3)<spacing and not (abs(old-mylist[i])==0):
  spacing=round(abs(old-mylist[i]),3)  
 old=mylist[i]

values=1+(max(mylist)-min(mylist))/spacing
print "Max, min, resolution: ",max(mylist),min(mylist),spacing
completelist=linspace(max(mylist),min(mylist),values).tolist()
mylist=completelist

voltages=[0,10,20,30,40,50,60,70,80,90,100,110,120,130,140,150,160,170,180,190,200,210,220,230,240,250,260,270,280,290,300]
myys=[0]*len(mylist)

for n in voltages:
 print "voltage: ",n,'\n'
 f=open(str(n)+'.dat','r')
 g=open(str(n)+'pad.dat','w')
 arrx=[]
 arry=[]

 for line in f:
  line=line.rstrip('\n')
  line=line.split(' ')
  try:
   line[0]=round(float(line[0]),3)
   line[1]=float(line[1])
   arrx+=[line[0]]
   arry+=[line[1]]
  except:
   pass

 for i in range(0,len(arrx)-1):
  try:
   myys[mylist.index(arrx[i])]=arry[i]
  except:
   a=0   

 for i in range(0,len(myys)-1):
  g.write(str(myys[i])+'\n')
f.close
g.close

h=open('mz.x','w')

for i in range(0,len(mylist)-1):
 h.write(str(mylist[i])+'\n')
h.close

Run
python makelist.py allmz.dat

Getting 'fail' messages is ok -- most likely it's due to an empty line. You can check that everything worked out by doing e.g.
wc 0pad.dat 220pad.dat

The numbers in the first column should be the same if the files have the same number of lines.

4. Make a matrix
Paste all the ms data side-by-side.
paste 0pad.dat 10pad.dat 20pad.dat 30pad.dat 40pad.dat 50pad.dat 60pad.dat 70pad.dat 80pad.dat 90pad.dat 100pad.dat 110pad.dat 120pad.dat 130pad.dat 140pad.dat 150pad.dat 160pad.dat 170pad.dat 180pad.dat 190pad.dat 200pad.dat 210pad.dat 220pad.dat 230pad.dat 240pad.dat 250pad.dat 260pad.dat 270pad.dat 280pad.dat 290pad.dat 300pad.dat > allpad.dat

5. Rotate the matrix
Create a script called rotate.sh:
gawk ' { for (i=1; i<=NF; i++) { a[NR,i] = $i } } NF>p { p = NF } END { for(j=1; j<=p; j++) { str=a[1,j] for(i=2; i<=NR; i++){ str=str" "a[i,j]; } print str } }' $1
and run
sh rotate.sh allpad.dat > matrix.rot.dat

6. Plot using gnuplot
See the following script for an example. Note that plotting in gnuplot using 'matrix' you don't get the benefit of proper axes labels. Instead we do a bit of on-the-fly maths to get the axes right. Specifically:
using (2999.3-(($1-1)/10)):(($2-1)*10):($3)

means that for the m/z axes ($1) we take the highest value (in our case 2999.3) and remove 0.1 m/z (our resolution) for each data point. This data is in each row. For the CV axes ($2), which goes down the columns in our matrix.rot.dat, we have thirty values. Each one corresponds to an increase in 10V starting at 0V, hence we multiply by 10. $3 is the intensity, which we don't need to fiddle with.

Save the following as cntr.gplt
set term png size 1000,1000 set output 'map.png' set zrange [-10:110] set yrange [0:300] unset surface set contour base set cntrparam levels 15 set view 0,0 unset ztics unset key splot 'matrix.rot.dat' matrix using (2999.3-($1/10)):($2*10):($3) with lines palette

Running
gnuplot cntr.gplt

VERY SLOWLY (in my case I had 0.9 M data points) gives us

If you're confused as to why the data doesn't go beyond 250 Volt (y axis) it's because I made a mistake at one point.

Changing the ranges a bit we get
And even more zoomed in:

Soon to come as a separate post:
 the same data, but as a stacked plot. Here's what it looks like though:

22 July 2013

480. MS data, part II. Plotting and comparing with predicted isotopic enveloped

NOTE: I've heard rumours about problems with Matt Monroe's calculator on Windows 7 Home, and on Windows 8. I've heard reports of it working on Windows 7 Professional. Given that wsearch also has issues,  this may be linked to VB.

This post is, like this one, is written with two particular students in mind.

MS here stands for Mass Spectrometry.

I'll be presuming that you have exported your data as a csv file as shown in http://verahill.blogspot.com.au/2013/07/474-exporting-data-from-wsearch32-and.html

Our scenario:
So you've exported your data as e.g. data.csv, and you have assigned a signal in your spectrum to a species, and you'd now like to plot the predicted and observed isotopic envelopes in a way that will help you compare them.

The signal we have identified is at 211.90 m/z and we think it belongs to [Ga(CH3OH)2(OH)(NO3)]+.


The Linux way:
You'll need: sed, gawk, gnuplot, pyisocalc or Matt Monroe's Molecular Weight calculator

1. Generating the isotopic envelope:

A. Using pyisocalc:
Set the charge to 1 and output the data to 1.dat, with a gaussian broadening factor of 0.3:
isocalc -f 'Ga(CH3OH)2(OH)(NO3)' -c 1 -o 1.dat -g 0.3

B. Using Matt Monroe's molecular weight calculator
Go to Tools/Isotopic Distribution Modelling
In the spectrum window, go to Edit, Copy Data Points, and paste into e.g. a Gedit window. Save as 1.dat


2. Formatting the data.csv for gnuplot (can skip for spreadsheet programs):
In a single line we remove the first eight lines, replace all commans (,) with tabs, only keep the m/z and relative isotopic abundance columns (2 an 4) and save the output to data.dat
tail -n +8 data.csv |sed 's/\,/\t/g'|gawk '{print $2,$4}' > data.dat

3. Plotting:

A. Using gnuplot:
Create a file called 1.gplt which contains the gnuplot commands:
set term postscript eps enhanced color set output '1.eps' set xrange [206:220] plot '1.dat' u ($1-0.05):($2*0.092) w lines ti 'Calculated' lc -1 lw 2,\ 'data.dat' u 1:2 w lines ti 'Observed' lc 1 lw 2
($1-0.05) means we're offsetting the calculated data by 0.05 m/z. ($2*0.092) means that we're scaling the calculated data intensity to match that of the observed. lc sets line colour and lw sets the width


If you want the output as png instead of eps, just change the first two lines to
set term png size 1000,667 set output '1.png'
Using pyisocalc
Using Matthew Monroe's calculator

B. Using QtiPlot
Qtiplot is in the debian repos and is 'origin'-like (as in Microcal Origin).

You'll need to rescaled your calculated data first, which is a major drawback:
cat 1.dat|gawk '{print $1-0.05,$2*0.095}'> 1_scaled.dat

Start QtiPlot and select Open. Make sure you select 'all files' as the file type. Open 1_scaled.dat.

Next, make sure that the spreadsheet is active, and go to File, Import, Import Ascii

Change the type of column 3

Select all columns and go to Plot, Line. Change the axes (double click on the axes and set the new ranges), set the top and right axes no to show, edit the titles etc.


The Windows way: 
You'll probably need: excel or open/libreoffice, origin, pyisocalc or Matt Monroe's Molecular Weight calculator

Doing this on windows is a PITA compared to Linux, and I don't have the time to go through it. If you do have Origin, it should be straightforward to translate the instructions above into an MS Win-like environment.

Any scaling will have to be done in Excel or a similar spreadsheet program. Not difficult, but it'll add a few extra steps.

16 January 2013

320. Wsearch32 in Wine

Wsearch32 is a windows program that does what it's supposed to -- open mass spectrometer data files. Because our students use it quite a lot and to save me time in training them, here's how to install wsearch32 and how to get started with it. It runs almost perfectly in Wine.

One notable thing about Wsearch is that it opens HP Agilent Chemstation .D files without any problems. It's notable because different versions of HP Agilent Chemstation can't even open files written by other versions (yup, it's true...) of the same damned program.

Another obvious advantage of Wsearch is that it makes it very easy to export data, although it only exports one spectrum at a time (i.e. you can't get the full time-dependent data set).

WSearch was written by Frank Antolasic at the RMIT in Melbourne, Australia.


What doesn't work under Wine: It will freeze if you try to open several files at the same time. This does not happen on native Windows.


Installation
Download it from here: http://www.wsearch.com.au/
wget http://www.wsearch.com.au/wsearch32/wsearch32.zip
unzip wsearch32.zip
and follow the instructions:
There's nothing odd about the installation process

It works as well as under windows


Screenshots
This is the default view

Click on the import icon (the red one in the left corner), and select your file. There are plenty of supported formats.

This is the TIC view. Click anywhere on the TIC to get the corresponding spectrum

TIC and spectrum view.

Click on the M/I icon on the right to get a list of all the data in the spectrum plot..
You can then save the spectrum in a range of ascii based formats.


You can get the acquisition headers under Chromatogram/List header info. You can also make ion plots  in the same menu.
Wsearch also comes with a simple isotopic pattern calculator.

The Help works fine under linux/wine


This is the free version of wsearch -- there is some functionality missing.


02 October 2012

251. Isotopic pattern and molecular weight calculator in Python for Linux

UPDATE: I've moved this code to https://sourceforge.net/projects/pyisocalc/

I'm not answering questions about this code -- it's a work in progress (updated every other day) and if you can't figure out how to use it  on your own, you're not the (currently) intended audience. For example, I've only had time to add a small subsection of the elements.

I originally implemented a very different solution -- a very exact and shiny one. The problem is that the number of permutations increases too rapidly, so that anything larger than e.g. B3(NO3)4 would use up 8 GB of RAM or more. 'Easy' molecules like C18 didn't use that much RAM, but still introduced a noticeable delay. Trimming the list of permutations introduces errors (small, hopefully) but speeds things up orders of magnitude.

In other words: this calculator is moderately fast (python), and very accurate (as far as I can tell). As I keep on looking at more and more complex examples for validation I find that I need to introduce various trimming functions to keep the matrices small.

Having said that, it's still kind of neat. Here's RuCl5^2- by my program and Matt Monroe's calculator (which I trust):


Monroe's output:


And plotting on top (scaled Monroe's by 1.08 to compensate for the error in scaling in Monroe's program which gives 108% abundance):


I removed the figures of W6O19^- since the error in the y axis scale in Monroe's program (went to 120%) made it a less good example, and the list of peaks is too long for easy comparison.
Here's another figure:
A hypothetical W6^- molecule


Anyway, here are a couple of syntax examples:

  Usage:
 ./isocalc 'Al2(NO3)3'
 ./isocalc 'Al2(NO3)3' -1
 ./isocalc 'Al2(NO3)3' -1 output.dat
 ./isocalc Al2N3O9 
  ./isocalc Al(NO3)3(OH)1
  ./isocalc Al(NO3)3(OH)
./isocalc Al

See here for the source code:
https://sourceforge.net/projects/pyisocalc/

29 September 2012

249. Quick but precise isotopic pattern (isotope envelope) calculator in Octave

UPDATE: Below is an accurate calculator,  but it is impractically slow for large molecules. A practical AND accurate calculator is found here:http://verahill.blogspot.com.au/2012/10/isotopic-pattern-caculator-in-python.html

Use the post below to learn about the fundamental theory, but then look at the other post to understand how to implement it.

Old post:
Getting fast and accurate isotopic patterns can be tricky using tools available online, for download or which form part of commercial packages. A particular problem is that different tools give slightly different values -- so which one to trust?

The answer: the tool for which you know that the algorithm is sound.

The extreme conclusion of that way of thinking is to write your own calculator.
Below is the conceptual process of calculating the isotopic pattern of a molecule using GNU Octave.

You need the linear algebra package:
sudo apt-get install octave octave-linear-algebra

b is the isotopic distribution for an element, and bb are the masses of those isotopes.

Once you've got a computational engine it's not too difficult to expand it for more general cases, account for charge, and instrument resolution.


Molecule: Cl4

b=[0.7578,0.2422];
bb=[34.96885,36.96885];
e=prod(cartprod(b,b,b,b),2);
ee=sum(cartprod(bb,bb,bb,bb),2);
n=4;
g=histc([ee e],linspace(min(ee),max(ee),n*(max(ee)-min(ee)+1)),2);
h=linspace(min(ee),max(ee),n*(max(ee)-min(ee)+1));
distr=e'*g;
plot(h,100.*distr/max(distr))
[h' (100.*distr/max(distr))']
Here's the output for n=1:
   139.87540    78.22048
   140.87540     0.00000
   141.87540   100.00000
   142.87540     0.00000
   143.87540    47.94141
   144.87540     0.00000
   145.87540    10.21502
   146.87540     0.00000
   147.87540     0.81620

And here's the output from Matt Monroe's calculator:
Isotopic Abundances for Cl4
  Mass/Charge Fraction  Intensity
   139.87541 0.3297755   78.22
   140.87541 0.0000000    0.00
   141.87541 0.4215974  100.00
   142.87541 0.0000000    0.00
   143.87541 0.2021197   47.94
   144.87541 0.0000000    0.00
   145.87541 0.0430662   10.22
   146.87541 0.0000000    0.00
   147.87541 0.0034411    0.82


Another molecule: Li2Cl2

Here's the code:
a=[0.0759,0.9241];
aa=[6.01512,7.01512];
b=[0.7578,0.2422];
bb=[34.96885,36.96885];
e=prod(cartprod(a,a,b,b),2);
ee=sum(cartprod(aa,aa,bb,bb),2);
n=1;
g=histc([ee e],linspace(min(ee),max(ee),n*(max(ee)-min(ee)+1)),2);
h=linspace(min(ee),max(ee),n*(max(ee)-min(ee)+1));
distr=e'*g;
plot(h,100.*distr/max(distr))
[h' (100.*distr/max(distr))']

ans =

    81.96794     0.67170
    82.96794    16.35626
    83.96794   100.00000
    84.96794    10.45523
    85.96794    63.71604
    86.96794     1.67079
    87.96794    10.17116

vs Matt Monroe's calculator:
Isotopic Abundances for Li2Cl2
  Mass/Charge Fraction  Intensity
    81.96795 0.0033082    0.67
    82.96795 0.0805564   16.36
    83.96795 0.4925109  100.00
    84.96795 0.0514932   10.46
    85.96795 0.3138084   63.72
    86.96795 0.0082288    1.67
    87.96795 0.0500941   10.17

We can then expand the code to allow for plotting
a=[0.0759,0.9241];
aa=[6.01512,7.01512];
b=[0.7578,0.2422];
bb=[34.96885,36.96885];
e=prod(cartprod(a,a,b,b),2);
ee=sum(cartprod(aa,aa,bb,bb),2);
n=1;

g=histc([ee e],linspace(min(ee),max(ee),n*(max(ee)-min(ee)+1)),2);
h=linspace(min(ee),max(ee),n*(max(ee)-min(ee)+1));
distr=e'*g;
gauss= @(x,c,r,s) r.*1./(s.*sqrt(2*pi)).*exp(-0.5*((x-c)./s).^2);
k=100.*distr/max(distr);

npts=1000;
resolution=0.25;

x=linspace(min(ee)-1,max(ee)+1,npts);
l=cumsum(gauss(x,h',k',resolution));
l=100*l./max(l(rows(l),:));
plot(x,l(rows(l),:))

which gives:

Compare with Matt Monroe's calculator:

27 September 2012

247. Setting up Openchrom (and using it to open Agilent .D ESI-MS files on Linux)

I've been using Wsearch (http://www.wsearch.com.au/wsearch32/wsearch32.htm) to process agilent chemstation ESI-MS spectra for the past few years. It and Matt Monroe's Molecular Weight calculator (why, oh why is there no comparable molecular weight calculator for linux?) have been the only two reasons why I've bother with Wine under Linux. Openchrom is written in java and so will run on both Good (Linux) and Evil (OS X and Win) operating systems.

Having finally discovered openchrom (v 0.6 so still early days) I can now finally retire wsearch from my own computers (it's still a good piece of software, but it's crippled to encourage the purchasing of a 'full' version, and I've had no luck purchasing a license from the author in spite of having tried several times during the past couple of years). OpenChrom can export an entire agilent experiment as a '3D' csv file which makes processing a lot more fun.

As an aside: I hate proprietary file formats since they prevent me from using my own tools (cat, sed, gawk, gnuplot, octave) when processing -- or at a minimum make it more difficult. Most universities and grant agencies now add a provision regarding data management in their grant acceptance agreements/work conduct policies. In general these provisions state that the data shall be made available publicly and /or managed by a university repository. What is REALLY missing is a clause about using open formats -- and that should be taken into account when acquiring new instrumentation. All else being equal, an instrument which is 'open' will be a lot cheaper to manage in the long run since you won't have to feel locked in in terms of software. That's incidentally a reason why I like Metrohm since they provide details of their RS-232 interface allowing you to write your own software.

Anyway, here's how to get set up:


1. Install Java v1.7 (need > 1.6)
You can either use openjdk 7 or (Oracle) Java. See here for a general guide to installing Oracle/Sun Java.

As for openjdk, you can easily install it:
sudo apt-get install openjdk-7-jdk

(the openjdk-7-jre package is enough if you don't want the full developer's kit)

Anyway.

Make sure that you've selected the right version:
 sudo update-alternatives --config java
There are 7 choices for the alternative java (providing /usr/bin/java).

  Selection    Path                                            Priority   Status
------------------------------------------------------------
  0            /usr/lib/jvm/java-6-openjdk-amd64/jre/bin/java   1061      auto mode
  1            /usr/bin/gij-4.4                                 1044      manual mode
  2            /usr/bin/gij-4.6                                 1046      manual mode
  3            /usr/bin/gij-4.7                                 1047      manual mode
  4            /usr/lib/jvm/j2re1.6-oracle/bin/java             314       manual mode
  5            /usr/lib/jvm/j2sdk1.6-oracle/jre/bin/java        315       manual mode
  6            /usr/lib/jvm/java-6-openjdk-amd64/jre/bin/java   1061      manual mode
 *7            /usr/lib/jvm/java-7-openjdk-amd64/jre/bin/java   1051      manual mode


2. Get openchrom
cd ~/tmp
wget http://sourceforge.net/projects/openchrom/files/REL-0.6.0/openchrom_linux.gtk.x86_64_0.6.0.zip
unzip openchrom_linux.gtk.x86_64_0.6.0.zip
cd linux.gtk.x86_64/OpenChrom/
sudo mkdir /opt/openchrom
sudo chown $USER /opt/openchrom 
cp * -R /opt/openchrom
chmod +x /opt/openchrom/openchrom

Stick

alias openchrom='/opt/openchrom/openchrom'

in your ~/.bashrc and source it.


3. Get plugins
On first boot you're asked whether you want to get additional plugins using the 'Openchrom marketplace'. Since I'm mainly processing data from an Agilent ESI-MS, I wanted the plugin for Agilent files. The website says that you need a license key for plugins BUT that it's free to register for one.

This is a 30-days trial version. Afterwards, you need a valid serial key.
You can get a free serial key after registration on http://www.openchrom.net.
You can use the converter for commercial or non-commercial purposes free of charge, but you are not allowed to redistribute this software without my permission.

Note, that clicking on links on the website didn't lead me to a link to download the plugin. Instead, in OpenChrom click on the Plug-ins menu:


As always, make sure you trust your suppliers.


And then you're done installing.

There's nothing odd about registering other than this: you will receive an email with a confirmation of your registration in clear text WITH YOUR PASSWORD. So...be aware of that.


4. You can now browse in the tree to the left and select your .D folder:

There's a bit of clever thinking when it comes to the functionality of the program. The upside of this I think will eventually be that it's easy to get a consistent experience for a set of users (not unimportant for a research group). The downside is that it's a bit clunky getting started. Play with it for an hour and you'll get the hang of it, so it's not really that much of a hurdle. Also, too many options seem to be context sensitive -- I am having real trouble finding various options under the 'Accurate' perspective which I can find under the 'default' perspective.


5. Some comments:

It's still early days for OpenChrom (v 0.6) , and there are a few minor issues which may or may not affect you:

* Registration keys. They are easy enough to get (register online, log in, click on the plug in online that you want and you'll see the key), but if you have installed a new plug in and open your first spectrum right after that you'll be asked for registration keys. It won't tell you for which plug in the dialogue you're seeing is though, so if you've just installed three different plug ins you'll have to do some trial-and-error. This is fixed in the upcoming version.

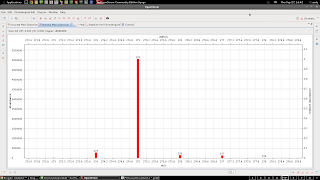
* Raw/gaussian plot of mass spectrum. This took a while to figure out, but you have to use perspectives. The default (heavily zoomed in) view looks like this:
This might be good enough for those organic types...us 108 element inorganic types want more detail
If you go to the top right corner, click on 'other' (perspectives)
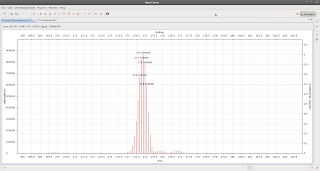
and select accurate you get
Bingo!
And then there's the obligatory wish list:

* A good quality isotopic pattern calculator would be nice. Anyone who has compared the output from different pieces of software will have discovered that different calculators may yield very different patterns. I think some of it boils down to truncation rather than incorrect isotopic ratios, but that just highlights how difficult it can be to implement a seemingly simple concept. The only calculator which I trust AND find useful is Matt Monroe's calculator -- the predicted patterns look good, and you get proper Gaussian broadening which means that it looks 'right'. This would be perfect as a plug-in. If only I knew how to properly implement it...

* A good quality ion generator -- some pieces of software (Hi Matt) allow you to select a handful of elements or fragments, pick a range of charges, input an m/z value and based on that spits out a list over possible identities for your signal. It's a good thing to have by your side the first time you look at a complex mixture trying to figure out what products may be present. This would be perfect as a plug-in. I've written this type of programmes before, but in python using for-loops...a vectorized version should be faster and maybe even easier to write.

26 July 2011

8. Very rudimentary peak-finding

The following scripts looks through a file with one x column and several y columns, and returns values larger than a certain cutoff.

Usage:
findpeaks filename columnnumber cutoffvalue
e.g.
findpeaks test.dat 3 0.01

findpeaks:
#!/usr/bin/python2.6
import sys
infile=sys.argv[1]
colno=int(sys.argv[2])
cutoff=float(sys.argv[3])

minsig=100
maxsig=0


spectra=open(infile,'r')


for spectrum in spectra:
spectrum=spectrum.rstrip('\n')
spectrum=spectrum.split(' ')
# print spectrum

try:
spectrum[colno]=float(spectrum[colno])
if spectrum[colno]>cutoff:
print spectrum[1],' ',spectrum[colno]

if spectrum[colno]<minsig:
minsig=spectrum[colno]
if spectrum[colno]>maxsig:
maxsig=spectrum[colno]


except:
a=0
maxsig=0
print "not working: "

print "max sig: ",maxsig,", minsig: ",minsig
spectra.close